Handling Hard Faults on a STM32
When writing code for a microcontroller, one typically connects a USB cable to the microcontroller which allows one to upload code and provides a serial interface for debug output. However, one might notice the debug output suddenly freezing with the microcontroller suddenly becoming unresponsive. This could either be because there was a while(1); loop in the code, or a hard fault has occurred.
This blog post delves deeper into how one might encounter a hard fault, and how to troubleshoot the line that causes a hard fault on a STM32 F4 - an ARM Cortex-M4 based microcontroller.
Introduction - ESP32 Arduino
I first encountered a hard fault while working with an ESP32 microcontroller using the Arduino IDE. I saw a Guru Meditation Error: Core 1 ... Core 1 register dump over UART.
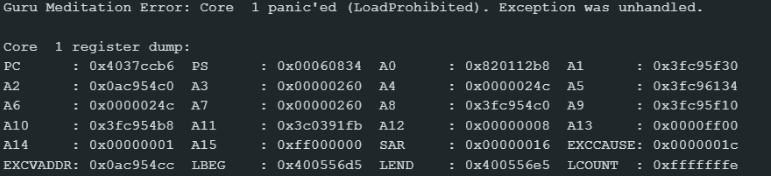
Image source: (ESP32-S3) Guru Meditation Error: Core 1 panic'ed (Unhandled debug exception) - Projects / Programming - Arduino Forum
I can't remember how I debugged or fixed it though a quick google search points to using the ESP32 Exception Deocer tool or running the CLI tool xtensa-esp32-elf-addr2line. A helpful resource I found for this topic was Locating Problems Using Backtrace & Coredump - - — ESP-Techpedia latest documentation
STM32F4
When using the STM32 however, its not so simple. My programming environment was Platform IO via the Arduino Framework. By default, a hard fault will lead to the microcontroller freezing. It does not auto reboot, nor does it dump the stack contents. I could only guess there was a hard fault happening (because I trusted that my code did not have any while(1) conditions) but I didn't know the cause of it. This made it extremely hard to debug. Most of the time I simply rewrote the program by reverting to the latest git commit but that was a band aid.
Note
A well-known solution is using a Watchdog timer which would reset the microcontroller if the Watchdog has not been kicked for a while. This solution should only be used for extremely rare events like a bit-flip causing a reset. If it is used to hide bugs then, the Watchdog timer should not be the solution! This LinkedIn post captures this point nicely.
I then chanced upon the article The Tower of Terror: A Bug Mystery | by Shiva Rajagopal | Fitbit Tech Blog | Medium where the author describes how the team debugged a hard fault by doing a core dump and tracing the hard fault to a divide by zero error. This made me wonder if I could do the same for my application. I needed to find a way to dump the contents of flash over UART.
Dumping Hard Fault Registers
One of my resources mentioned the use of a HardFault_Handler which main jumps to in the event of a hard fault. I did the same by creating a hardfault_handler.cpp
Source: How to debug a HardFault on an Arm® Cortex®-M STM3... - STMicroelectronics Community
Notice that the name of the function matches exactly. Also that I have to declare it as extern "C". This is because the Arduino Framework is in C++ which changes the name of the function. By using the extern "C" declaration, I tell the compiler to use C naming conventions: don't change the name of the function so that main will jump here in the event of a hard fault.
The next step is to dump the contents of the register. This blog post - How to debug a HardFault on an ARM Cortex-M MCU - Registers Prior to Exception | Interrupt was quite helpful in figuring out how to do that.
Upon exception entry some registers will always be automatically saved on the stack. Depending on whether or not an FPU is in use, either a basic or extended stack frame will be pushed by hardware.
Regardless, the hardware will always push the same core set of registers to the very top of the stack which was active prior to entering the exception. ARM Cortex-M devices have two stack pointers,
msp&psp. Upon exception entry, the active stack pointer is encoded in bit 2 of theEXC_RETURNvalue pushed to the link register. If the bit is set, thepspwas active prior to exception entry, else themspwas active.
TLDR, we need to know which stack pointer to use. The code below determines the stack pointer, and passes the active stack pointer as an argument into a c function hard_fault_handler_c which I have defined
extern "C" void HardFault_Handler(void) {
    __asm volatile (
        "TST lr, #0b100       \n"  // Test bit 2 of LR (EXC_RETURN)
        "ITE EQ           \n"
        "MRSEQ r0, MSP    \n"  // If bit 2 is 0, use MSP
        "MRSNE r0, PSP    \n"  // If bit 2 is 1, use PSP
        "B hard_fault_handler_c \n"  // Branch to C function
    );
}
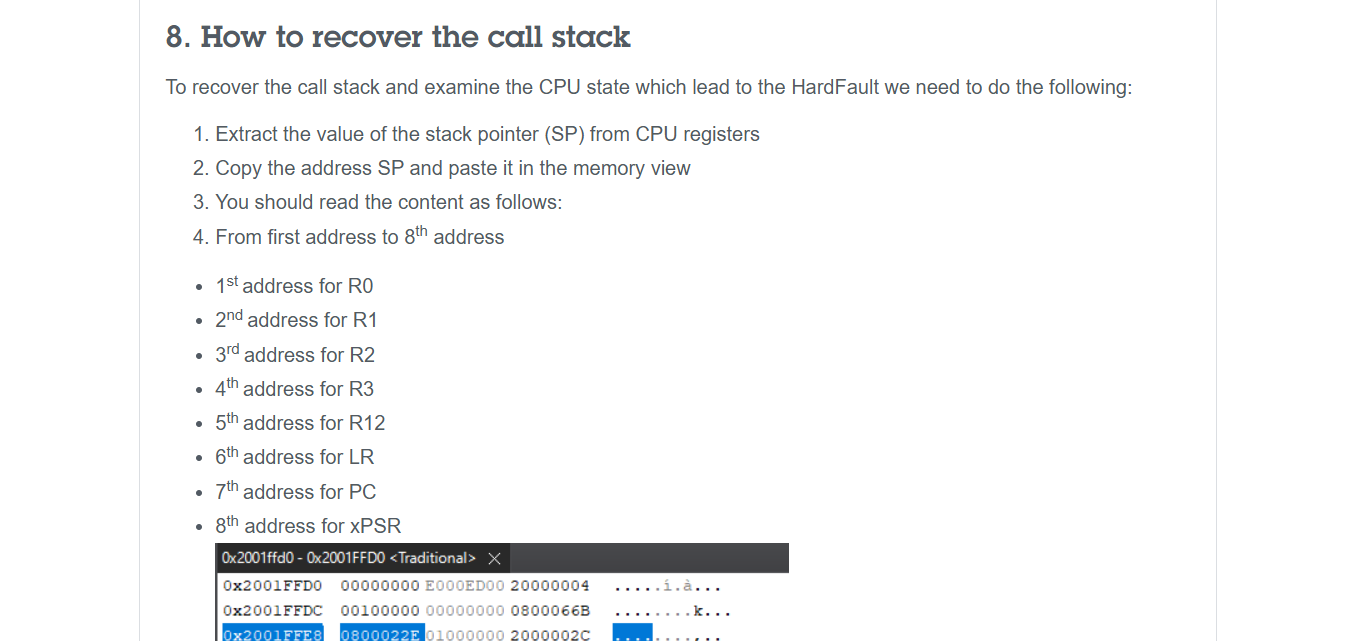
According to How to debug a HardFault on an Arm® Cortex®-M STM3... - STMicroelectronics Community, we can figure out which part of the stack is mapped to which register.
In the same file, I define hard_fault_handler_c. Note the extern "C" declaration which prevents the function name from being changed, allowing the assembly code defined above to jump to this function. Notice how I have obtained the values of the Link Register (LR), Program Counter (PC) and the Program Status Registers (xPSR)
extern "C" void hard_fault_handler_c(uint32_t* stack_ptr) {
    uint32_t lr  = stack_ptr[5];  // Return address before fault
    uint32_t pc  = stack_ptr[6];  // Crashing instruction
    uint32_t psr = stack_ptr[7];  // Status register

    volatile uint32_t* CFSR = (uint32_t*) 0xE000ED28;
    volatile uint32_t* HFSR = (uint32_t*) 0xE000ED2C;
    volatile uint32_t* BFAR = (uint32_t*) 0xE000ED38;

    uint32_t cfsr = *CFSR; // Summary of fault which took place
    uint32_t hfsr = *HFSR; // Reason hardfault exception was triggered
    uint32_t bfar = *BFAR;  // Bus Fault Address Register
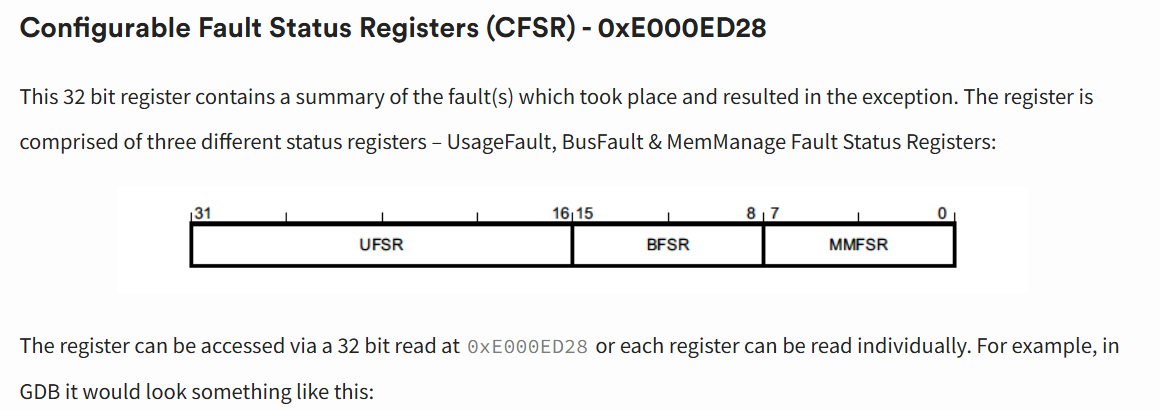
LR, PC, and PSR only tell us which instruction caused the fault. However, it does not tell us why a hard fault was triggered. To do this, we need to read the values of some registers. This includes the Configurable Fault Status Registers (CFSR), the HardFault Status Register (HFSR) and the Bus Fault Address Register (BFAR). You can read more about these registers here: How to debug a HardFault on an ARM Cortex-M MCU - Relevant Status Registers | Interrupt
Understanding the Registers
Fault Registers - The reason for the Hard Fault
To understand the fault that caused the Hard Fault, we can look at which bits in which registers are set. For instance, a Divide By Zero Error will set bit 9 in UFSR, which is part of CFSR.
How to debug a HardFault on an ARM Cortex-M MCU - CFSR | Interrupt
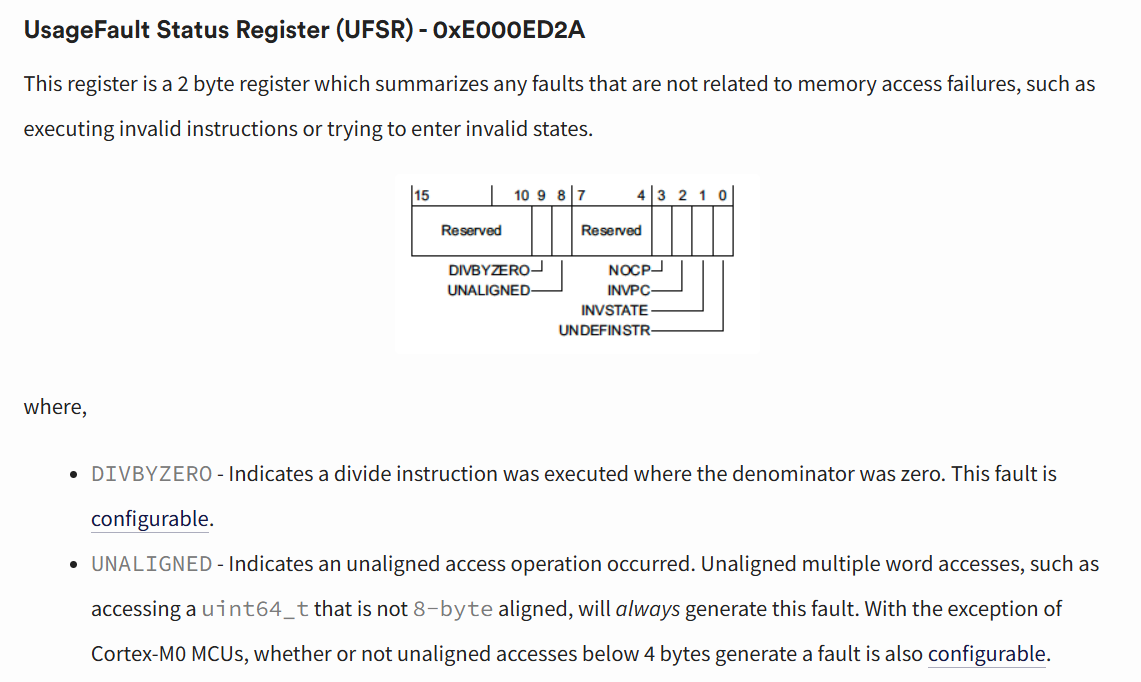
Source: How to debug a HardFault on an ARM Cortex-M MCU - UFSR| Interrupt
To obtain the exact line that caused the hard fault, you need to look at PC and LR. The arm-none-eabi-addr2line tool, which can be downloaded from GNU Arm Embedded Toolchain Downloads, needs to be run on the .elf file to match the address in the PC or LR registers to the line/file of the compiled binary. In platformio, the .elf file can be found at .pio/build/<board_name>/firmware.elf.
To obtain the line stored in PC and LR, run
Running the above command on the PC and LR will get you 2 different lines.
PC (Program Counter)
It points to the instruction currently being executed (or the next one to be fetched).
- In a Crash: The PC tells you exactly where the CPU was when the hard fault occured.
- In addr2line: If you pass the PC address to addr2line, it will point to the specific line of code that triggered the fault
LR (Link Register)
It stores the "return address." When you call a function (using the BL or Branch with Link instruction), the CPU automatically copies the next PC address into the LR.
- In a Crash: The LR tells you who called the function that crashed. It is the "parent" of the current execution point.
- In addr2line: If you pass the LR address, it will point to the line of code immediately following the function call in the calling function.
This stack overflow comment gives abit more detail on the inner workings of SP, LR, and PC: https://stackoverflow.com/a/8238688
TLDR: PC is more fine-grained looking at the exact line while LR is more coarse-grained, it tells you the next function to be called after the function that caused the hard fault.
Conclusion
This article describes how to deal with hard faults by dumping the values of registers that tell one why a hard fault occurred. This is done by creating a extern "C" void HardFault_Handler(void) code (in C++ for Platform IO), and using Assembly to dump the contents of the stack. One can print it over UART as a loop, or store it somewhere if needed.
By obtaining PC and LR, one can see the line in which the hard fault occurred.
Apart from this, reading the values in CFSR, HFSR and BFAR can tell one why the hard fault occurred.
A full snippet of the code I have used for platform IO is written below. It is in the src folder. On detecting a hard fault, the code prints the PC, LR, xSPR, CFSR, HFSR, and BFAR to USART6. Of course, the code can be modified to perform other actions like blinking an LED or writing to another stream in the event of a hard fault.
I hope the code snippet is helpful for anyone using a similar platform for debugging hard faults.
/**
 * @file fault_handler.cpp
 * @author Samuel Yow
 * @date 2025-08-08
 *
 * To verify the line that caused the error, run
 * ```
 * arm-none-eabi-addr2line -e .pio/build/genericSTM32F407VGT6/firmware.elf <PC VAL>
 * ```
 */

#include <stdint.h>
#include <stdio.h>
#include "stm32f407xx.h"

// USART for printing debug output
#define USART_SR    (*(volatile uint32_t*)(USART6_BASE + 0x00))
#define USART_DR    (*(volatile uint32_t*)(USART6_BASE + 0x04))

/**
 * @brief Print char c to USART6
 *
 * 32e6: 1s
 * 32e5 100ms
 * 32e4 10ms
 *
 * @param c
 */
void uart_print_char(char c) {
    try_count = 0;
    while (!(USART_SR & (1 << 7)) && (try_count < wait_instructions))
    {
        try_count++;
        __asm volatile ("nop");
    }
    USART_DR = c;
}

void uart_print_str(const char *s) {
    while(*s) // Loop until the current character is '\0' (Null terminated)
    {
        // Send current character, then increment pointer
        uart_print_char(*s++);
    }
}

/**
 * @brief Delay of 1s via ASM
 *
 */
void simple_delay_1s(){
    uint32_t count = 32000000UL;

    // Each nop -> 1 cycle
    // Given 32MHz clock, i suppose you need 32M counts to reach 1s

    while (count--) {
        __asm volatile ("nop");
    }
}


/**
 * @brief Function that is called after the branch, and dumps stack details
 * and CFSR (Configurable Fault Status Registers) and HFSR (HardFault Status Register)
 * and BFAR (Bus Fault Address Register) over USART6
 */
extern "C" void hard_fault_handler_c(uint32_t* stack_ptr) {
    uint32_t lr  = stack_ptr[5];  // Return address before fault
    uint32_t pc  = stack_ptr[6];  // Crashing instruction
    uint32_t psr = stack_ptr[7];  // Status register

    volatile uint32_t* CFSR = (uint32_t*) 0xE000ED28;
    volatile uint32_t* HFSR = (uint32_t*) 0xE000ED2C;
    volatile uint32_t* BFAR = (uint32_t*) 0xE000ED38;

    uint32_t cfsr = *CFSR; // Summary of fault which took place
    uint32_t hfsr = *HFSR; // Reason hardfault exception was triggered
    uint32_t bfar = *BFAR; // Bus Fault Address Register

    char hard_fault_msg[100];

    while(1)
    {

        // Stack Registers
        snprintf(hard_fault_msg, sizeof(hard_fault_msg),
            "PC:0x%08X, LR:0x%08X, xPSR:0x%08X\r\n",
            (unsigned int) pc,(unsigned int) lr,(unsigned int) psr);
        uart_print_str(hard_fault_msg);

        //Fault Status Registers + BFAR
        snprintf(hard_fault_msg, sizeof(hard_fault_msg),
                 "CFSR:0x%08X, HFSR:0x%08X, BFAR:0x%08X\r\n",
                 (unsigned int)cfsr, (unsigned int)hfsr, (unsigned int)bfar);
        uart_print_str(hard_fault_msg);

        simple_delay_1s();
    }
}

/**
 * @brief On hard fault, look at the LR and push registers on the stack
 * to the hard_fault_handler_c function
 *
 */
extern "C" void HardFault_Handler(void) {
    __asm volatile (
        "TST lr, #0b100       \n"  // Test bit 2 of LR (EXC_RETURN)
        "ITE EQ           \n"
        "MRSEQ r0, MSP    \n"  // If bit 2 is 0, use MSP
        "MRSNE r0, PSP    \n"  // If bit 2 is 1, use PSP
        "B hard_fault_handler_c \n"  // Branch to C function
    );

}
Resources
These resources will be helpful when dealing with a Hard Fault occurring on a ARM Cortex M4 Microcontroller
- How to debug a HardFault on an ARM Cortex-M MCU | Interrupt
- How to debug a HardFault on an Arm® Cortex®-M STM3... - STMicroelectronics Community
These resources will be helpful when dealing with a Hard Fault on an ESP32 (Xtensa & Risc-V Architecture)